Mastering Bollinger Bands for Crypto Trading.
Article Structure
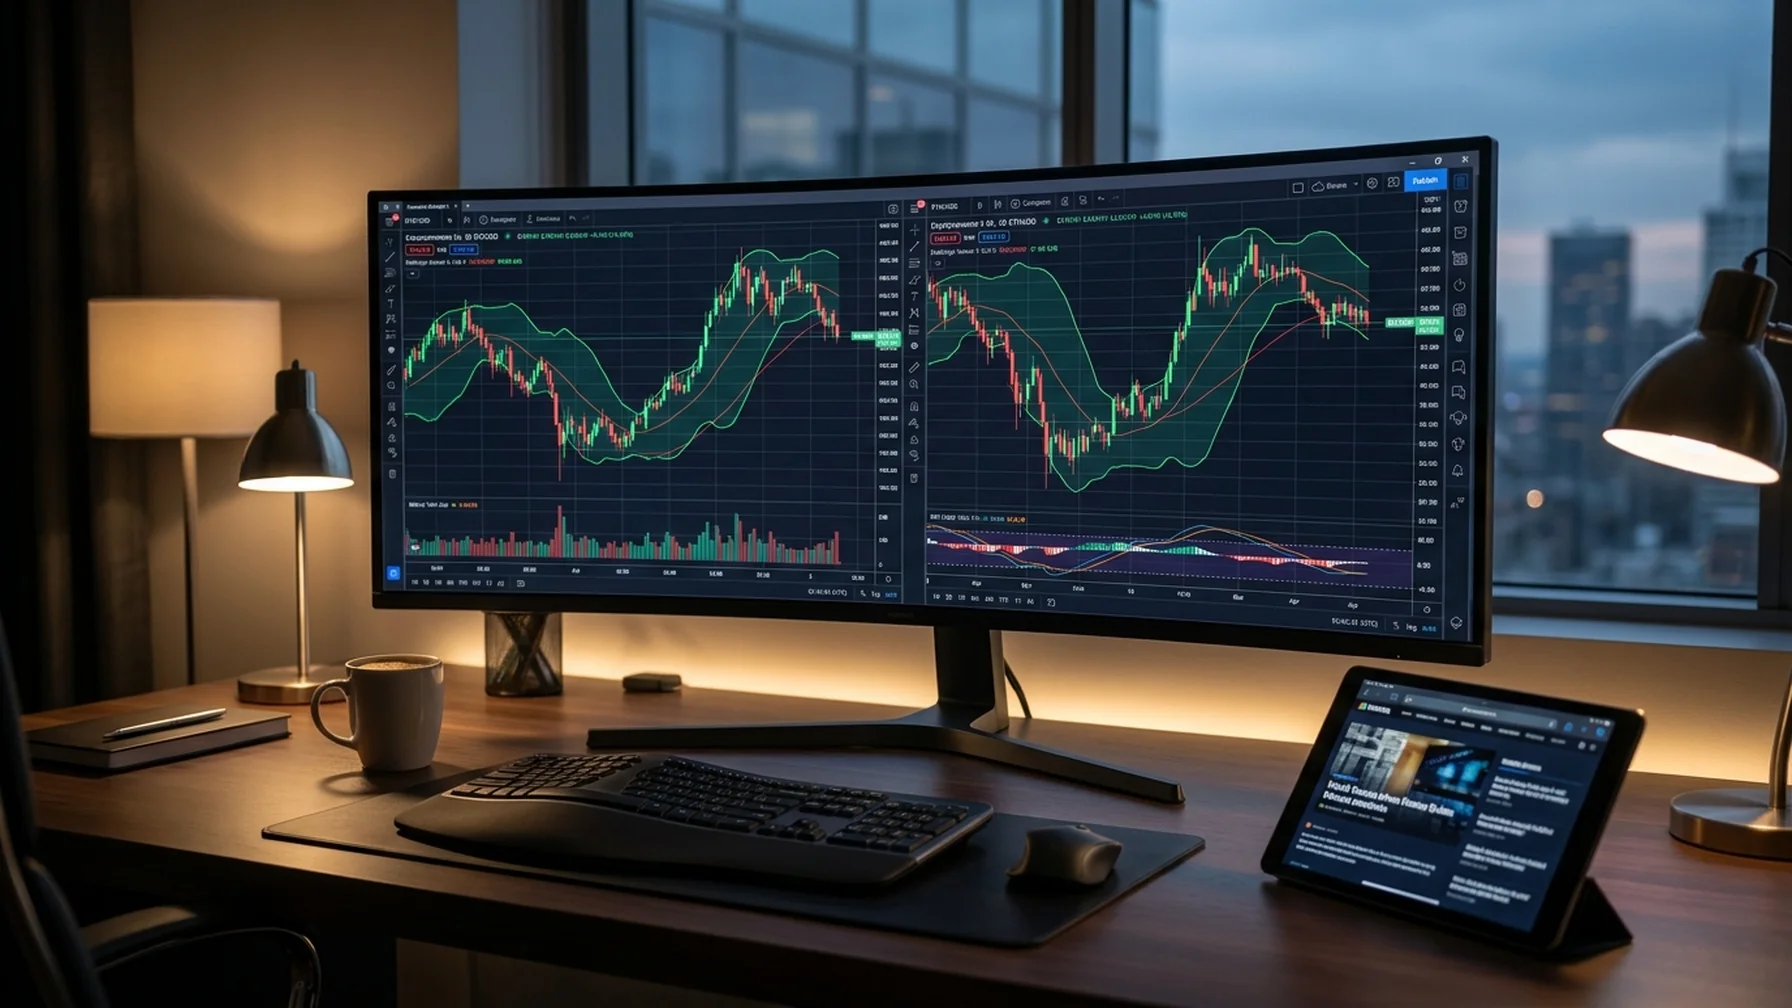
Bollinger Bands are a widely-used tool in crypto trading, helping traders analyze market volatility and predict potential price movements. By mastering the use of Bollinger Bands in crypto charts, traders can gain valuable insights into market trends and make informed decisions. This article will delve into how Bollinger Bands can be integrated with various market indicators to enhance crypto trading strategies.
What Are Bollinger Bands?
Bollinger Bands consist of three lines plotted on a price chart: the middle band, which is a simple moving average (SMA); the upper band, which is the SMA plus two standard deviations; and the lower band, which is the SMA minus two standard deviations. These bands expand and contract based on market volatility, offering traders a visual representation of potential price ranges. When the price touches or crosses these bands, it can signal potential buy or sell opportunities.
Key Components of Bollinger Bands
To better understand Bollinger Bands, here are their core components:
- Middle Band: The simple moving average (SMA) of the asset's price, usually over 20 periods.
- Upper Band: The SMA plus two standard deviations, indicating a potential resistance level.
- Lower Band: The SMA minus two standard deviations, indicating a potential support level.
- Band Width: The distance between the upper and lower bands, signaling volatility; wider bands mean higher volatility.
Understanding these components helps traders interpret market conditions and make informed decisions.
How to Use Bollinger Bands in Crypto Trading
Using Bollinger Bands effectively involves a few key steps. Here's a simple guide:
- Select the cryptocurrency you wish to analyze and obtain historical price data.
- Apply the Bollinger Bands indicator on a price chart, typically with a 20-period moving average and standard deviations of 2.
- Observe the price movements relative to the bands; touching the upper band may signal a sell opportunity, while touching the lower band may suggest a buy opportunity.
By following these steps, traders can better leverage Bollinger Bands to make informed trading decisions based on price action and market volatility.
Funding Rate and Open Interest with Bollinger Bands
Understanding how Bollinger Bands interact with metrics like funding rate and open interest can enhance your trading strategy. These metrics provide insights into market sentiment and potential price movements.
Here is a table summarizing how these metrics can be utilized with Bollinger Bands:
Table: Funding Rate and Open Interest with Bollinger Bands
| Metric | Interpretation with Bollinger Bands |
|---|---|
| Funding Rate | High rate with price near upper band suggests bullish sentiment; low rate with price near lower band indicates bearish sentiment. |
| Open Interest | Increasing open interest with price at band extremes may signal a breakout or reversal. |
By integrating these metrics, traders can better anticipate market movements and optimize their crypto trading strategies.
On-Chain Metrics and Bollinger Bands
On-chain metrics, such as transaction volume and active addresses, provide direct data from the blockchain. These metrics can offer valuable insights when used alongside Bollinger Bands. Key on-chain metrics to consider include:
- Transaction Volume: Measures the total amount of transactions on a blockchain.
- Active Addresses: Shows the number of unique addresses involved in transactions.
- Hash Rate: Indicates the computational power used in mining.
Integrating these metrics with Bollinger Bands can help traders make informed decisions by providing a clearer picture of market conditions.
Combining RSI with Bollinger Bands
The Relative Strength Index (RSI) is often used alongside Bollinger Bands. RSI measures the speed and change of price movements, helping identify overbought or oversold conditions. For example, if RSI indicates an asset is overbought and the price touches the upper Bollinger Band, it may suggest a price correction is imminent.
Support and Resistance Levels in Bollinger Bands
Support and resistance levels are crucial in trading. Bollinger Bands can help confirm these levels. For instance, if the price hits the lower band and coincides with a strong support level, it might indicate a buying opportunity. Similarly, hitting the upper band near a resistance level might suggest a selling opportunity.
Trading Volume and Bollinger Bands
Analyzing trading volume is essential for understanding market strength. A price breakout from Bollinger Bands with high trading volume can indicate a strong trend. Conversely, a breakout with low volume might be a false signal.
Using Candlestick Patterns with Bollinger Bands
Candlestick patterns can be paired with Bollinger Bands to predict market movements. A bullish engulfing pattern near the lower band might suggest a potential upward move, while a bearish engulfing pattern near the upper band could indicate a downward trend.
Leveraging the Fear and Greed Index with Bollinger Bands
The Fear and Greed Index measures market sentiment. By combining this index with Bollinger Bands, traders can gauge the emotional state of the market. Extreme fear might coincide with prices touching the lower band, suggesting potential buying opportunities.
By integrating Bollinger Bands with these various indicators and metrics, crypto traders can gain a comprehensive view of the market. This approach helps in making informed decisions, reducing risks, and enhancing trading strategies.