Understanding Candlestick Patterns in Crypto: A Comprehensive Guide.
Article Structure
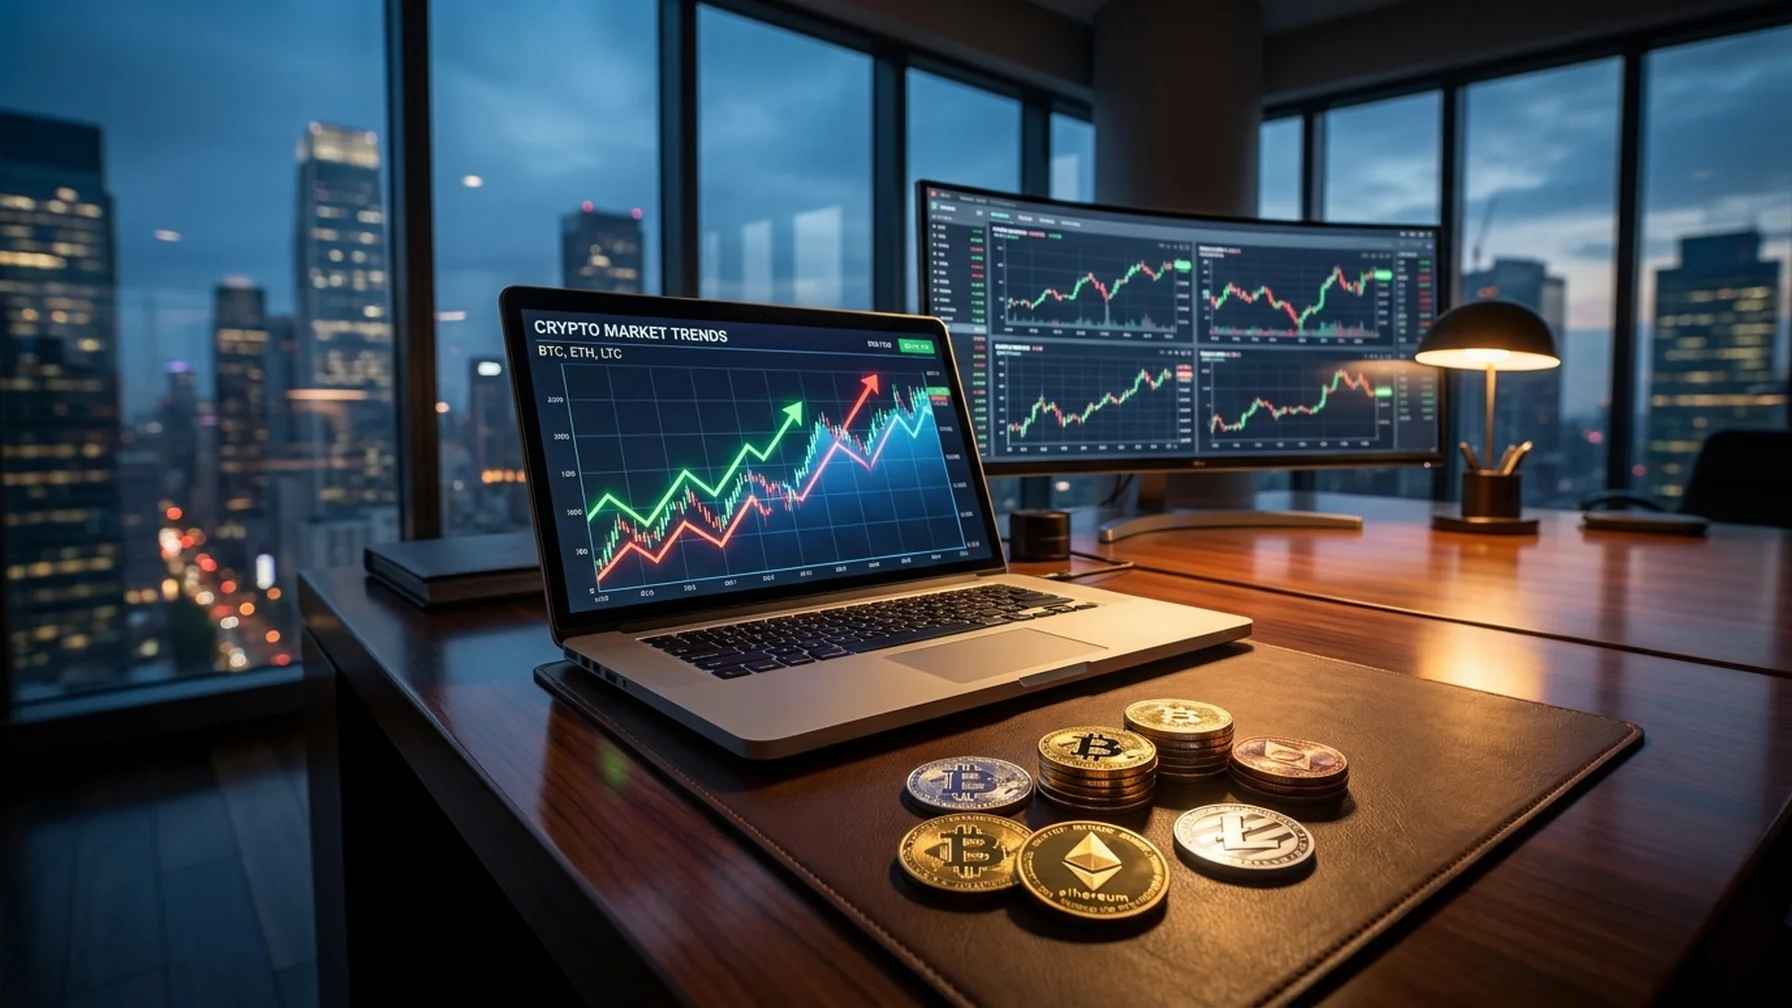
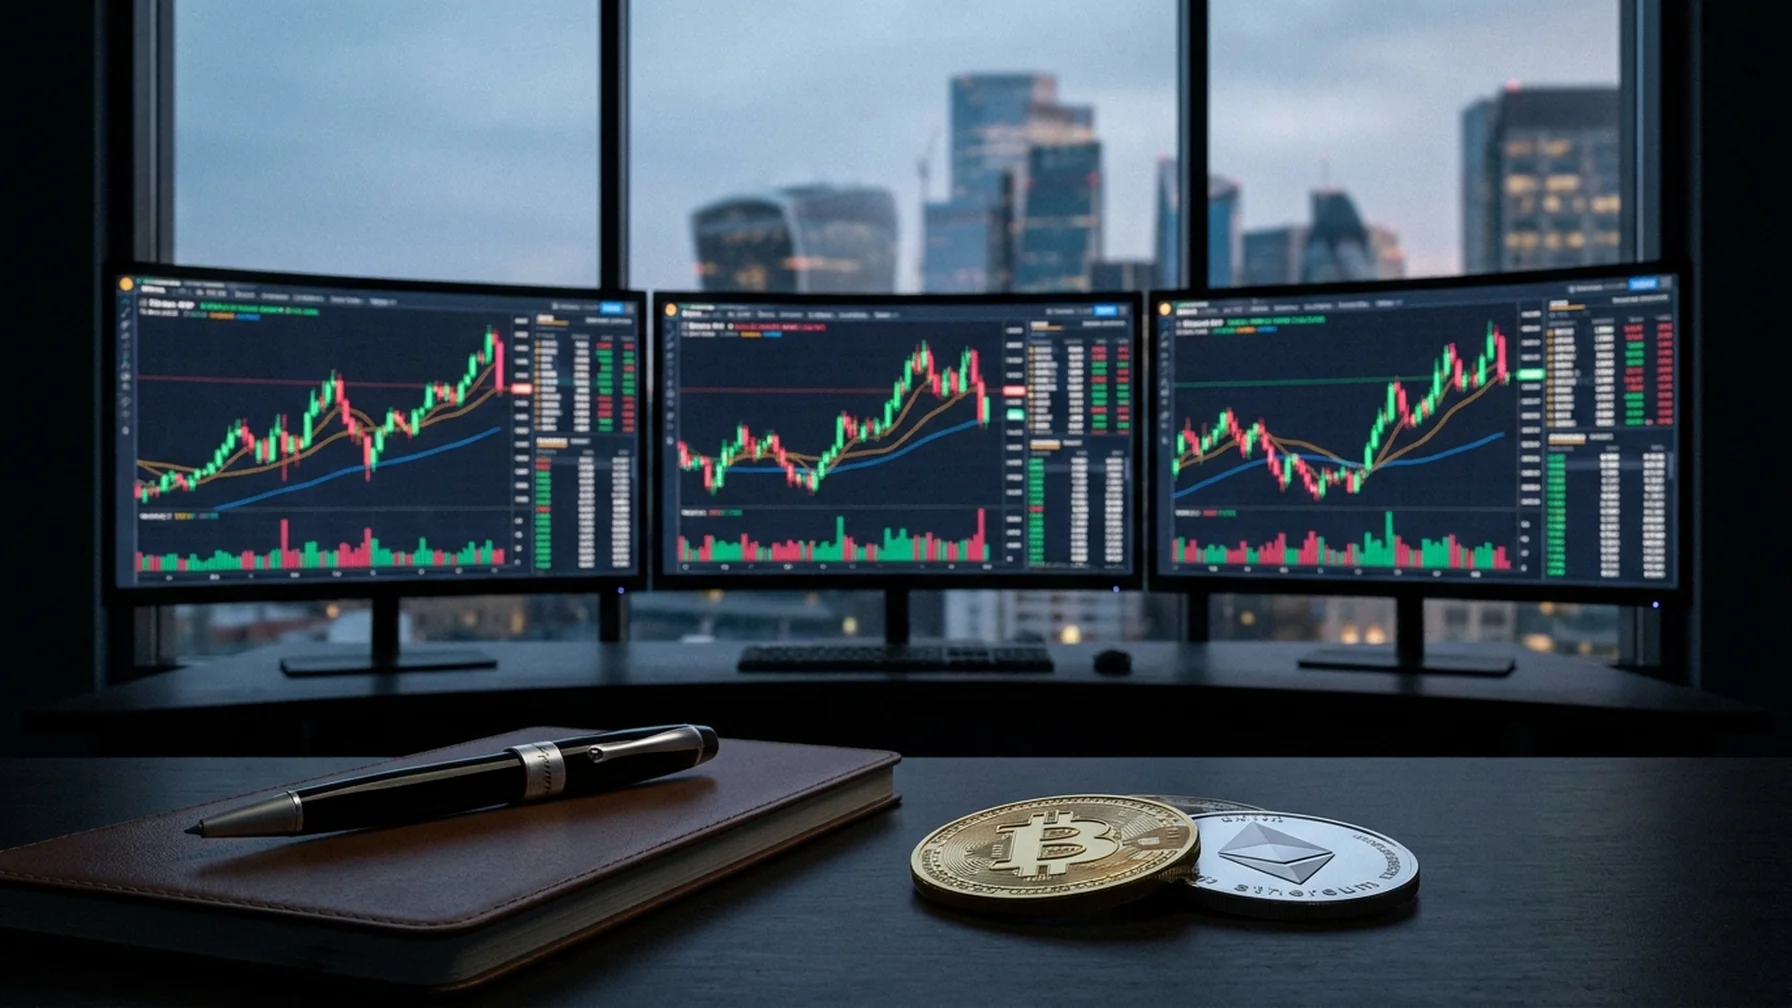
For crypto enthusiasts and traders, reading and analyzing market data is crucial. One of the most popular tools for this is candlestick patterns. These patterns help traders make informed decisions by providing insights into market trends. This article delves into candlestick patterns in crypto and how they intertwine with other technical indicators and market metrics.
The Basics of Candlestick Patterns in Crypto
Candlestick patterns are a form of price chart used to represent and visualize the price movements of an asset. Each candlestick shows four key pieces of information: open, close, high, and low prices within a specific time frame. The 'body' of the candlestick reflects the range between opening and closing prices, while the 'wicks' show the high and low price fluctuations.
Understanding these patterns allows traders to predict future price movements, providing a strategic edge in crypto trading.
Common Candlestick Patterns in Crypto Trading
There are several candlestick patterns that traders frequently observe in cryptocurrency markets. Here are the most common ones:
- Hammer: Indicates a potential reversal from a downtrend to an uptrend.
- Doji: Suggests market indecision and potential reversal.
- Engulfing Pattern: A strong reversal signal, with a larger candle engulfing the previous one.
- Hanging Man: A potential bearish reversal indicator.
- Morning Star: Signals a possible bullish trend formation.
- Evening Star: Indicates a possible bearish trend formation.
Each pattern offers clues about possible market direction, helping traders decide on their next move.
Integrating Technical Indicators with Candlestick Patterns
While candlestick patterns are powerful, combining them with technical indicators enhances their predictive capability. Here are a few essential indicators:
The following table outlines key technical indicators that complement candlestick analysis:
| Indicator | Description |
|---|---|
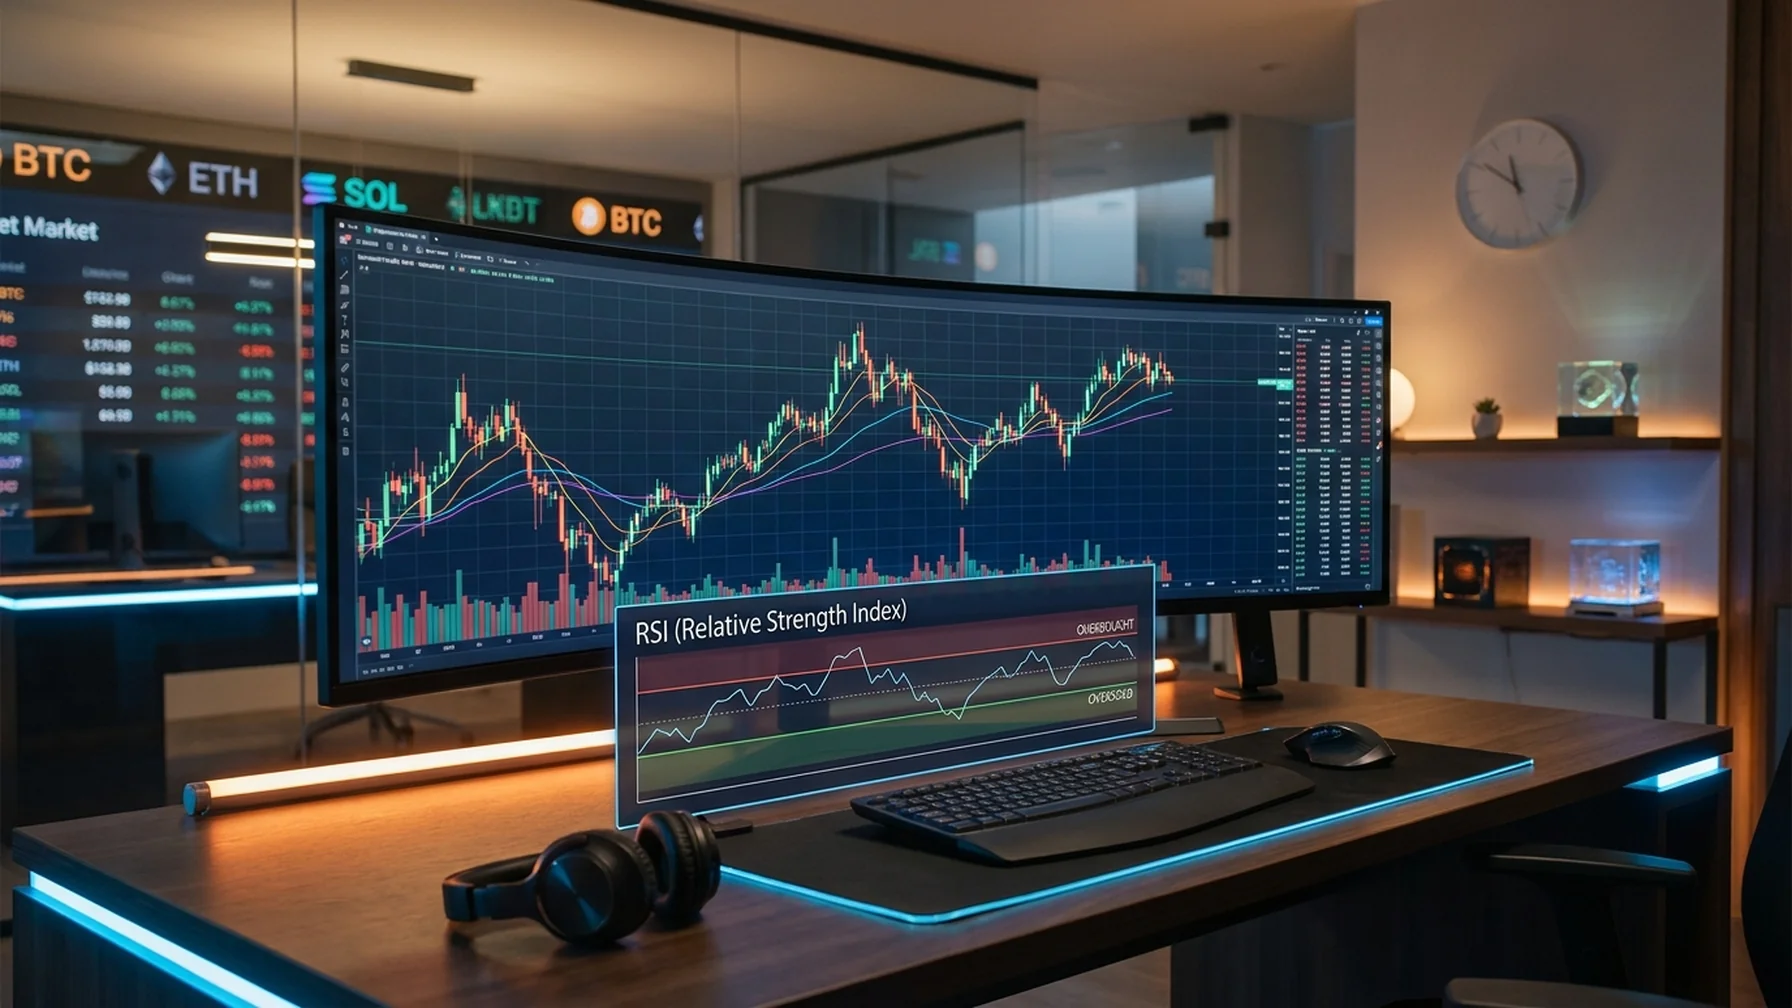
| RSI (Relative Strength Index) | Measures the speed and change of price movements and helps identify overbought or oversold conditions. |
| MACD (Moving Average Convergence Divergence) | Shows the relationship between two moving averages of a security's price and helps identify potential buy and sell signals. |
| Bollinger Bands | Use standard deviation to create bands above and below a simple moving average, indicating volatility. |
By analyzing these indicators alongside candlestick patterns, traders can achieve a more comprehensive view of market trends.
Support and Resistance Levels in Crypto Trading
Support and resistance levels are key concepts in technical analysis, representing price points where an asset tends to stop and reverse. Candlestick patterns often form around these levels, providing valuable insights for traders.
Support levels act as a floor, where buying interest is strong enough to overcome selling pressure, while resistance levels serve as a ceiling, where selling interest overcomes buying pressure. Recognizing these levels helps traders set entry and exit points.
Analyzing Market Metrics
To further enhance trading strategies, it's important to consider various market metrics:
- Market Cap: Represents the total market value of a cryptocurrency, providing insights into its size and stability.
- Trading Volume: Indicates the total amount of cryptocurrency traded. High volume often signals strong market interest and potential price movement.
- Fear and Greed Index: Measures market sentiment, helping traders gauge if the market is overly bullish or bearish.
These metrics, when combined with candlestick patterns, offer a more detailed view of the market landscape.
On-Chain Metrics and Their Impact
On-chain metrics provide insights directly from blockchain data, offering a unique perspective on market dynamics. Metrics such as funding rate, open interest, and liquidations give traders a view of market sentiment and potential future movements.
By analyzing these alongside candlestick patterns, traders can better anticipate market shifts and adjust their strategies accordingly.
Macro Indicators and Their Influence on Crypto
External economic factors can also impact the crypto market. Indicators such as the DXY (U.S. Dollar Index), oil prices, and the VIX (Volatility Index) can provide context for market movements. Additionally, traditional assets like gold and yields have correlations with crypto price behavior.
Understanding how these macro indicators affect crypto helps in anticipating broader market trends and making more informed trading decisions.
The Role of Stablecoins in Crypto Markets
Stablecoins, cryptocurrencies pegged to a stable asset like the U.S. dollar, play a crucial role in the crypto ecosystem. They provide liquidity and a mechanism for traders to quickly move in and out of volatile markets.
Monitoring stablecoin flows and their impact on the market can offer additional insights when combined with candlestick analysis.
Conclusion: Mastering Candlestick Patterns in Crypto
Reading crypto charts and understanding candlestick patterns in crypto trading are essential skills for any trader. By integrating these patterns with technical indicators, market metrics, and macroeconomic factors, traders can gain a deeper understanding of market trends and make informed decisions. Whether you're a seasoned trader or a newcomer, mastering these tools is key to navigating the dynamic world of cryptocurrency trading.